This chapter describes the healthcare setting and the register data sources used in the studies of this PhD project. The diabetes classification algorithms used in the project are described along with the sources of survey data used to validate them. Finally, the study designs, populations, statistical methods and ethical approvals of the three papers in the dissertation are described.
3.1 Setting: The Danish healthcare system
Denmark is divided into five administrative regions that are responsible for providing public healthcare services to their residents through public hospitals and contract agreements with private actors in the primary care sector. Private actors include GPs, other specialist practices (e.g. ophthalmologists) and other healthcare professionals (e.g. podiatrists). In addition, the 98 Danish municipalities are obliged to offer resources to prevent and/or manage chronic disease, such as programmes on managing T2D through diet and physical exercise.
Although referral to outpatient hospital care is possible, most patients with T2D are treated by the GP. All native Danes and migrants with residence permit have free access to general practice. In the tax-funded Danish public healthcare system, Danish citizens and migrants with residence permit have equal access to services. Nearly all services are provided free of charge, although T2D patients must pay some out-of-pocket fees for podiatrist care and prescription drugs at pharmacies. Yearly medication expenditures are partially reimbursed from €132, and expenditures beyond €553 are fully covered (2019 limits).1 In contrast, 50% of all expenditures related to diabetes-specific podiatrist care are covered by the public health insurance regardless of the patient’s total expenditures.2
3.2 Register data sources
In Denmark, civil registration, public healthcare contacts and drug prescriptions are recorded with a unique personal identifier (the CPR number) given to all Danish residents at immigration or birth. This covers the entire population and allows complete linkage between data sources; this forms the foundation of several nationwide Danish healthcare registers.[3] The following section briefly describes the data extracted from these registers and from other data sources used in the PhD project. A detailed list of variables and code values used in each study is available in the supplementary material attached to each paper.
3.2.1 The Danish Civil Registration System
The Danish Civil Registration System contains civil registration data on all residents in Denmark. Information on migrations and country of origin was extracted together with data on age, sex, equivalised disposable household income,4 employment status, and region of residence.
3.2.2 The Danish National Patient Register
The Danish National Patient Register contains information on all hospital admissions and outpatient contacts. Data on diagnoses of diabetes and cardiovascular complications along with data on procedures relating to retinal screening and treatment of cardiovascular complications was extracted for 1994-2018. At the time of this PhD project, the clinical coding system in use was the International Classification of Diseases, \(10^{th}\) revision (ICD-10), which was implemented in 1994.5
3.2.3 The Danish National Health Service Register
The Danish National Health Service Register contains information on all public healthcare services provided in the primary care sector. The data is essentially healthcare billing information, and serves as the basis for payment from the public health insurance to the healthcare providers. Each type of service has a unique SPECIALE code (e.g. all diabetes-specific podiatrist care services are contained as sub-codes under SPECIALE code 54). Information on diabetes-specific services performed at podiatrist and ophthalmologist practices from 1990 through 2018 was extracted together with point-of-care HbA1c testing performed in general practice.
3.2.4 The Danish National Prescription Registry
The Danish National Prescription Registry contains detailed information on all prescription drugs purchased at Danish pharmacies. These registrations serve to determine reimbursement awarded to each purchase from the public health insurance. Each purchase is classified according to the Anatomical Therapeutic Chemical (ATC) classification. Information on purchases of GLD, LLD, ACEI, ARB, and APT was extracted for 1995-2018.
3.2.5 The Danish Register of Laboratory Results for Research
The Danish Register of Laboratory Results for Research contains information on clinical biomarker samples analysed at clinical biochemistry departments in Danish hospitals. Except for point-of-care tests, all biomarker samples taken in the primary healthcare sector are analysed in hospital laboratories. Compared to the other registers, this is a relatively new data source; it was initially launched in 2013 and only recently achieved nationwide coverage.6
At the time of data extraction, the Central Denmark Region, one of five administrative regions in Denmark, which covers a population of 1.3 million inhabitants, corresponding to 22% of the entire Danish population, was not yet covered in the register. To address this issue, laboratory results from this part of the population were extracted directly from the Clinical Laboratory Information System, a clinical database that stores all laboratory results analysed in Central Denmark Region. Data on HbA1c, LDL-C, and UACR analyses were extracted for 2011-2018.
3.3 Diabetes classification algorithms
As described previously in Section 1.5.4, the currently available register-based diabetes classifiers have yet to incorporate the emerging register data on routine HbA1c testing. Wishing to take advantage of this data, we developed a new classifier, the OSDC. As a point of reference, we developed an implementation of the RSCD diabetes classifier (version 1.0, August 2016) according to official documentation.7
The following sections describe the algorithms behind the RSCD and OSDC diabetes classifiers. The overall design and the flow of populations are summarised in Figure 3.1. The advantages and disadvantages of their designs are discussed in Chapter 5.
Figure 3.1: Overall diabetes classifier design differences and population flows
3.3.1 The Open-Source Diabetes Classifier
This classifier first identifies a population of individuals with any type of diabetes mellitus and then splits this population into T1D and T2D by identifying individuals with T1D and classifying the remainder of the diabetes population as T2D.
In the OSDC, diabetes is defined at the second occurrence of any event across the four types of inclusion events listed below. All available data is used, except purchases of GLD, which are restricted to data from 1997 onwards.
HbA1c measurements of ≥48 mmol/mol after censoring:
Results of samples taken during pregnancies; potential gestational diabetes mellitus (GDM).
Hospital diagnoses of diabetes.
Diabetes-specific services received at podiatrist.
Purchases of GLD after censoring:
Brand drugs for weight loss, e.g. Saxenda.
Purchases during pregnancies; potential treatment of GDM.
Metformin purchases in women below age 40; potential treatment of polycystic ovary syndrome (PCOS).
Diabetes type is classified as either T1D or T2D based on patterns of purchases of insulins (including analogues) and hospital primary diagnoses of T1D and T2D. Classification as T1D requires an individual to fulfil either of the following criteria:
Must have purchased only insulins and never any other type of GLD, and have at least one diagnosis of T1D
Must have a majority of T1D diagnoses from endocrinological departments (or from other medical departments, in the absence of contacts to endocrinological departments), and a purchase of insulin within 180 days after onset of diabetes, with insulin contributing at least two thirds of all defined daily doses of GLD purchased.8
In populations generated on a fixed index date (such as the cross-sectional studies associated with this dissertation), individuals classified as T1D cases must have purchased insulins in the last year prior to the index date.
Individuals not classified as T1D cases are classified as T2D cases.
3.3.2 The Register of Selected Chronic Diseases
Formally, the RSCD includes two separate algorithms, RSCD-T1D and RSCD-T2D, which identify T1D and T2D, respectively. In practice, however, they are inter-dependent, as individuals identified by the T2D classifier are excluded from the T1D classifier.
In the RSCD, diabetes is defined by type-specific diagnoses of T1D or T2D and purchases of GLD. Individuals are defined as having T1D or T2D if they meet any of the inclusion criteria of the algorithm without fulfilling any of its exclusion criteria.
The RSCD was implemented as described below, based on available documentation,7 which may not completely reflect the source code use by the Danish Health Data Authority to generate the register population. Although the implementation is generally ad verbatim to the documentation, a few areas of the documentation did not address all outlier cases, and in these cases we expanded the algorithm slightly from the documentation. For example, the documentation did not present a method to classify individuals with both a diagnosis of T1D and T2D on the day of their latest diagnosis, if these individuals also had an equal number of T1D and T2D diagnoses in their records. Following documentation to the letter would omit these patients completely from the diabetes population, and we assessed that this was likely a limitation in the documentation rather than the algorithm. Our implementation included these individiduals as T2D cases, which seems most likely a priori.
3.3.2.1 Classification of type 2 diabetes
For classification of T2D, the inclusion criteria are:
Any purchases of non-insulin GLD.
A hospital diagnosis of T2D as the most recent type-specific diabetes diagnosis.
Exclusions from the T2D population include:
Women that have purchased only metformin and have any diagnoses of PCOS, purchases of clomifene or combination drugs containing antiandrogens and oestrogens.
Individuals with only one recorded inclusion event.
Individuals with no recorded inclusion events in the last 10 years prior to the index date.
3.3.2.2 Classification of type 1 diabetes
For classification of T1D, the inclusion criteria include:
Any purchases of insulins.
A hospital diagnosis of T1D as the most recent type-specific diabetes diagnosis.
Exclusions from the T1D population include:
Women with any diagnoses of GDM, who have purchased GLD only in the period from 280 days prior to their first diagnosis of GDM until 280 days after their last diagnosis of GDM.
Individuals classified as T2D.
Individuals without any purchases of GLD, or only one purchase and no hospital records of T1D.
Individuals with no insulin purchases in the last 10 years prior to the index date.
3.4 Questionnaire data used in validation
To validate the above diabetes classifiers, self-reported data from two surveys was retrieved. The design and contents of these surveys are described below.
3.4.1 The Health In Central Denmark survey
Health In Central Denmark is a survey conducted in the Central Denmark Region using digital and postal questionnaires. The first wave of the survey was performed in 2020 and included all inhabitants aged 18-74 years with prevalent diabetes according to the OSDC on 31 December 2018 plus an equally sized group of OSDC non-diabetes cases (matched to diabetes cases by sex, age, and municipality). The survey collected self-reported data related to health in general, with a special focus on items related to diabetes mellitus, such as current disease, diabetes type, and age at onset. A total of 44,659 OSDC diabetes cases and 46,195 matched OSDC non-diabetes cases were invited to the survey, and 51,854 (57%) responded.9
3.4.2 The National Health Survey
The National Health Survey is a nationwide repeated digital and postal questionnaire survey, which is conducted in a representative sample of Danish residents aged 16 or above. It collects self-reported data related to mental and physical health in general, such as current or former chronic diseases, and includes a question on diabetes of any type.10 This project utilised the subset of data from participants in the 2017 survey, who resided in Central Denmark Region. In this regional subset of the survey, a total of 52,000 individuals were invited and 32,400 (62%) responded.11 Data from this survey was used only for supplementary validation analyses.
3.5 Study design and population
In addition to developing a code package for the statistical programming language R containing the source-code behind the diabetes classifiers, three studies were conducted. Study I was designed to examine the validity of the register-based definitions of T1D and T2D. After validating the two candidates, the most accurate classifier, the OSDC, was chosen to identify the study populations of T2D for use in studies II and III.
Table 3.1: Overview of studies
Study I
Study II
Study III
Study population
Participants in the Health In Central Denmark survey
Native Danes and first-generation migrants with T2D on 1 Jan 2018.
Native Danes and first-generation migrants with T2D on 1 Jan 2019
Sample size
29,391
254,097
253,364
Calendar period
Register-classified diabetes type on 31 Dec 2018
Monitoring: Oct 2015/2016 to Dec 2017.
Biomarker levels: 1 Jan 2018.
Pharmacological treatment: during 2018.
GLD use during 2019.
Design
Validation study
Cross-sectional study
Cross-sectional study
Data sources
Questionnaire and register data
Register data
Register data
Age
18-74 years
25-99 years
25 years and older
Variables
Validated standard:
Register-classified diabetes type
Gold standard:
Self-reported diabetes type
Primary independent variable:
Migrant origin
Dependent variables:
Timely T2D monitoring.
HbA1c and LDL-C control.
Use of recommended pharmacological treatment.
Primary independent variable:
Migrant origin
Dependent variables:
Use of GLD combination therapy.
Use of oral GLD types.
Use of injection-based GLD types
Statistical analyses
Validation metrics:
Sensitivity, specificity, positive and negative predictive value
Robust Poisson regression:
Relative risk of non-fulfilment of guideline recommendations.
Robust Poisson regression:
Relative risk of GLD use
Notes
Some details were left out for the sake of brevity, i.e. the analysis of T2D prevalence in study II and exclusion criteria.
Abbreviations: GLD: Glucose-lowering drugs. T2D: Type 2 diabetes.
3.5.1 Study populations
3.5.1.1 Study I
Validation analyses were performed in a subset of respondents in the Health in Central Denmark survey.
Among survey respondents, 2,411 were excluded due to missing data on diabetes items. A totalt of 2,093 individuals with self-reported onset of diabetes after 31 December 2018 were excluded, as diabetes cases onset after the index date would erroneously be evaluated as false-negative cases in the register-based classifiers due to the delay from register-classification on the index date (31 December 2018) until questionnaire responses (November 2020).
After these exclusions, 47,350 survey respondents remained. However, as survey invites were conditioned on OSDC diabetes status, the survey population was biased towards the OSDC classification, and the OSDC diabetes prevalence was 43.7% (20,692 individuals). To account for this, we first estimated the OSDC diabetes prevalence to be 9.3% (2,483 individuals) in a random sample of 26,665 individuals from the background population with the same age, sex and municipality distributions as the OSDC non-diabetes cases of respondents. To offset the oversampling of OSDC diabetes cases in the survey, OSDC diabetes cases were randomly subsampled to 2,733 individuals to achieve an unbiased OSDC diabetes prevalence of 9.3% in the final study population of 29,391 individuals.
Figure 3.2: Flow of individuals into the Health In Central Denmark survey and the study population of study I
3.5.1.2 Study II
Register data was used to identify 262,837 individuals with prevalent T2D on 1 January 2018 (index date) from a background population of 3,864,528 native Danes or first-generation migrants from the selected origin categories aged 25-99 years and residing in Denmark for at least three years on the index date.
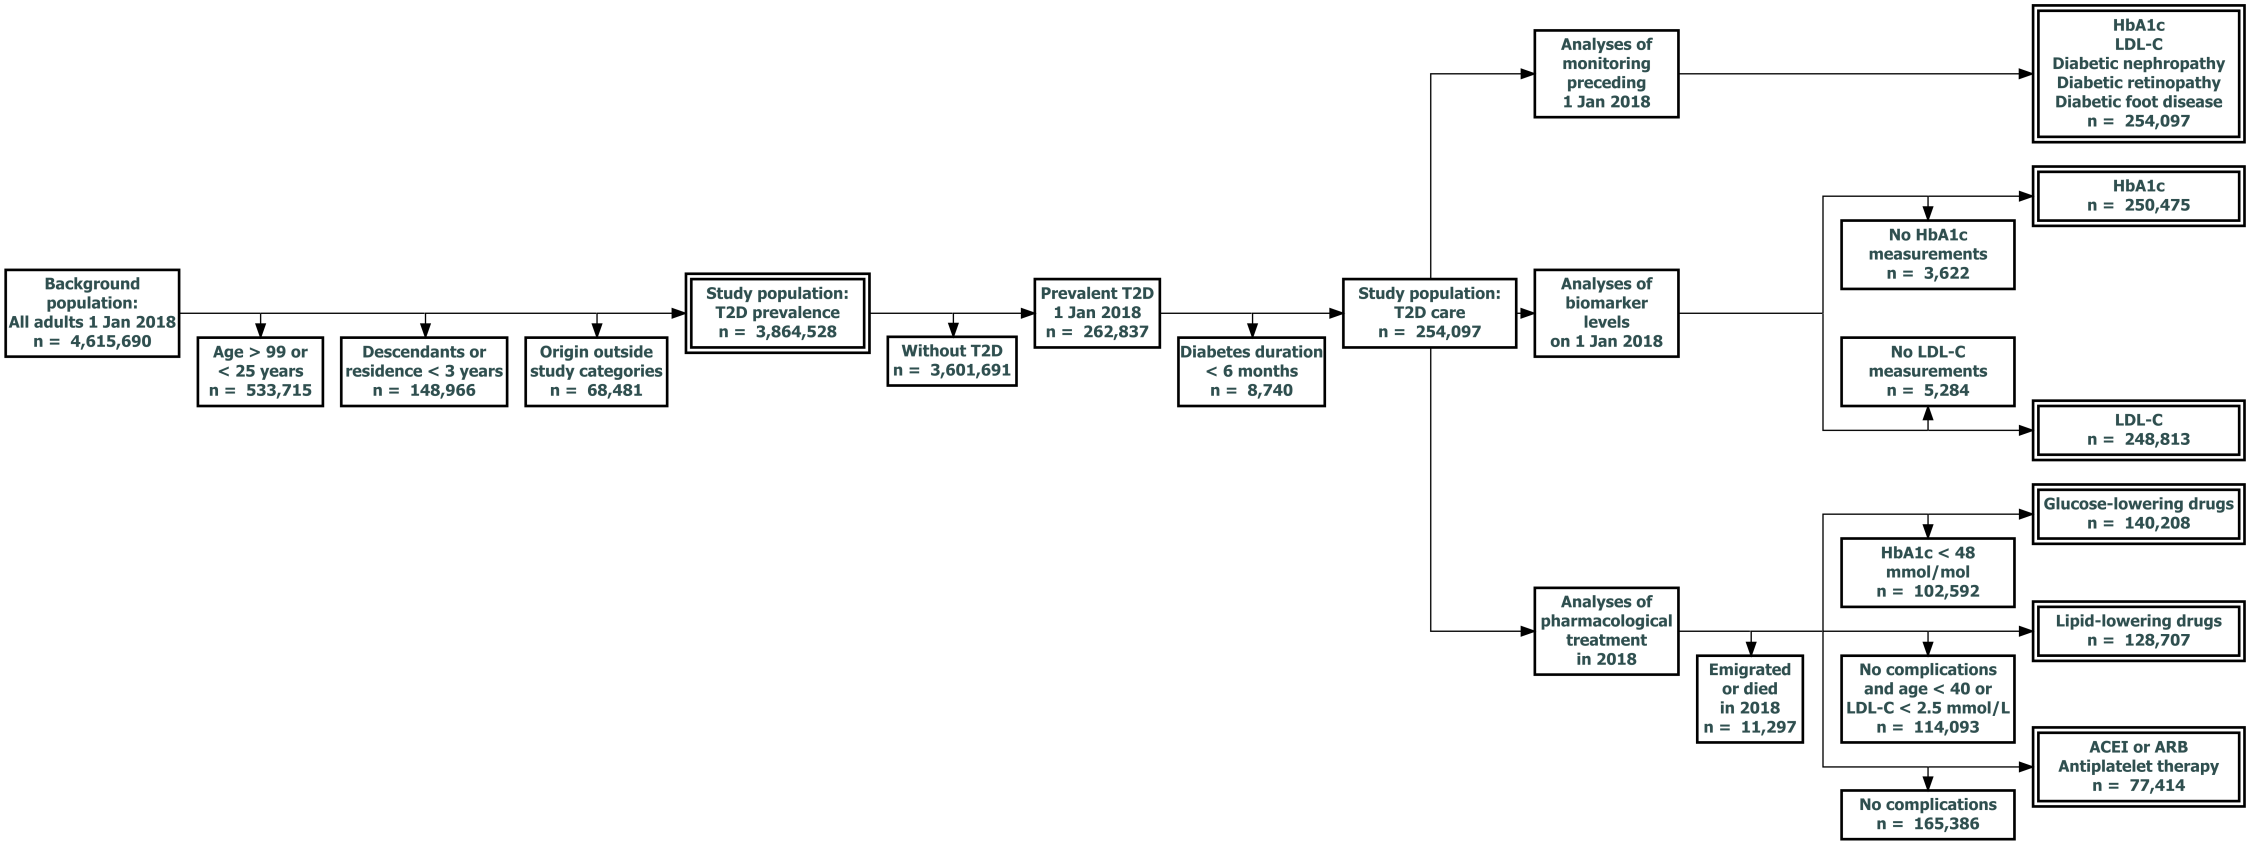
T2D prevalence was studied in the above population. To study T2D care where clinically relevant, the eleven analyses of T2D care were performed in distinct subsets of the population with T2D, as outlined below and in Figure 3.3:
All analyses of T2D care were performed in a subset of 254,097 individuals with T2D onset at least six months prior to the index date to allow time for baseline screening, initiation of pharmacological treatment and subsequent biomarker control to occur in the newly diagnosed.
Monitoring was evaluated among all these individuals:
Monitoring of HbA1c, LDL-C, nephropathy, retinopathy and foot disease: 254,097 individuals.
Biomarker levels were evaluated in those with at least one measurement prior to the index date:
HbA1c levels: 250,075 individuals.
LDL-C levels: 248,813 individuals.
Each analysis of pharmacological treatment was limited to individuals with a clear guideline recommendation for that particular treatment according to complication status or biomarker levels on the index date (excluding individuals not alive and residing in Denmark in the year following the index date, thus unable to purchase medication):
GLD: HbA1c ≥48 mmol/mol at the most recent measurement: 140,208 individuals.
LLD: prevalent macrovascular complications or DKD, or age above 40 with LDL-C above 2.5 mmol/L: 128,707 individuals.
ACEI/ARB & APT: prevalent macrovascular complications or DKD: 77,414 individuals.
Figure 3.3: Study population flow in analyses in study II
3.5.1.3 Study III
Register data was used to identify 275,525 individuals with prevalent T2D on 1 January 2019 (index date) from a background population of 4,084,564 individuals above age 25 years. Among individuals with T2D, 269,011 native Danes or first-generation migrants from the selected origin categories residing for at least three years in Denmark on the index date were included. After exclusion of 15,647 individuals without records of HbA1c or LDL-cholesterol within three years prior to the index date, the study population contained 253,364 individuals.
3.5.2 Outcomes
3.5.2.1 Study I
Self-reported diabetes type, the validation gold standard, was categorised as either T1D (self-reported T1D), T2D (all other types of diabetes) or no diabetes, corresponding to the diabetes types discernible from the register-based classifiers.
3.5.2.2 Study II
Twelve outcomes were defined as follows:
Prevalent T2D was defined as OSDC-classified T2D prevalent on the index date.
T2D care quality was evaluated in the scope of failure to meet guideline recommendations in terms of monitoring, biomarker levels and pharmacological treatment.
T2D monitoring was evaluated in time-frames prior to index date that matched guideline-recommendations, with three months of leeway added (e.g. monitoring within 15 months was considered to fulfil the guideline recommendation, even if the specific type of monitoring is recommended yearly in the guidelines):
Monitoring of HbA1c was identified by records of biomarker samples between 1 October 2016 and 31 December 2017 in the Register of Laboratory Results for Research or the Clinical Laboratory Information System. Additional monitoring of HbA1c using point-of-care tests was identified by records in the DanishNational Health Service Register.
Monitoring of LDL-C: was identified by records of biomarker samples between 1 October 2016 and 31 December 2017 in the Register of Laboratory Results for Research or the Clinical Laboratory Information System.
UACR-screening for diabetic nephropathy was identified by records of biomarker samples between 1 October 2016 and 31 December 2017 in the Register of Laboratory Results for Research or the Clinical Laboratory Information System.
Screening for diabetic retinopathy was identified by records of retinal photo screening for diabetic retinopathy between 1 October 2015 and 31 December 2017, either at hospital departments in the DanishNational Patient Register, or diabetes-specific examinations at ophthalmologist practice recorded in the Danish National Health Service Register.
Screening for diabetic foot disease was identified by records of diabetes-specific podiatrist services received between 1 October 2016 and 31 December 2017 in the Danish National Health Service Register.
Biomarker levels on the index date were evaluated through the most recent measurement of HbA1c and LDL-C before the index date:
The outcome measure for HbA1c control was ≥53 mmol/mol.
The outcome measure for LDL-C control was ≥2.6 mmol/L.
Pharmacological treatment was assessed in the year following the index date. Treatment was defined by at least one purchase of the respective type of drug based on the following ATC codes (including subcodes):
GLD: ATC codes A10.
LLD: ATC codes C10.
ACEI/ARB: ATC codes C09A-C09D.
APT: ATC codes B01AC.
3.5.2.3 Study III
Eight outcomes were defined across combination therapy and individual GLD types used.
GLD combination therapy was analysed using the following two outcome definitions:
Any combination therapy: two or more GLD types used.
Triple combination therapy: three or more GLD types used.
For each GLD type, individuals were defined as users if at least two purchases were made during 2019, and at least one of these was made in the last six months of the year. The following types of GLDs (ATC codes including subcodes) counted towards the number of GLD types used by an individual in a year (fixed-dose combination drugs counted towards both of their component drug types), and they also defined the six outcomes for analysis of individual GLD type usage:
In addition, thiazolidinediones (ATC codes A10BG) and repaglinide (ATC codes A10BX02) counted towards GLD combination therapy, but they were not analysed as individual drug types due to the very low prevalence of use of these drugs.
3.5.3 Primary variable of interest: migrant status
Migrant status and country of origin were defined according to the definitions by Statistics Denmark. To accommodate the expected heterogeneity between different countries of origin, aggregation of countries was kept to a minimum and limited to countries with similar reasons for migration and with racial and cultural similarities. Attempting to preserved the individual origin countries with the most T2D cases in Denmark, and aggregating some countries based on the United Nations M49 geoscheme, the population was grouped into nine origin categories:
Native Danes
Europe (M49: Europe, excluding countries of the former Yugoslavia)
Middle East (M49: Northern Africa, Western Asia, excluding Turkey, plus Afghanistan and Iran)
And the six remaining individual countries with the most T2D cases (in order of number of cases):
Turkey
(Former) Yugoslavia
Pakistan
Sri Lanka
Somalia
Vietnam
3.5.4 Other explanatory variables
3.5.4.1 Socioeconomic variables
Age and diabetes duration on the index dates were treated as continuous variables. Household income was based on the three-year average of equivalised disposable household income prior to index dates, converted to the corresponding percentile in the background population and treated as a continuous variable. As a measure of acculturation, duration of residence was calculated from the date of first migration into Denmark, converted to a categorical variable with native Danes categorised in the maximally acculturated group. Employment status was categorised as Employed (including students and others), Retired or Unemployed based on the year prior to index dates.
3.5.4.2 Clinical variables
Prevalent macrovascular complications were assessed by primary diagnosis codes of stroke, ischaemic heart disease and peripheral arterial disease (and associated procedure codes) prior to index dates. Diabetic kidney disease was defined as a UACR ≥300 mg/g measured within three years prior to index dates (study II: within 27 months). Other types of microvascular complications were not included due to insufficient data.
Study III used HbA1c levels and LDL-C levels at baseline as continuous covariates for adjustment and LLD use within a year prior to the index date. Finally, the analyses of the use of individual GLD drug types in study III adjusted for combination therapy categorised as Monotherapy or no GLD, Dual combination and Triple combination or more.
3.6 Statistical analysis
Statistical analyses were performed in RStudio12 using R version 413 and a range of open-source code packages for computations14–18 and visualisation.19,20
This section describes our overall statistical analysis strategy and the specific statistical analyses of each study.
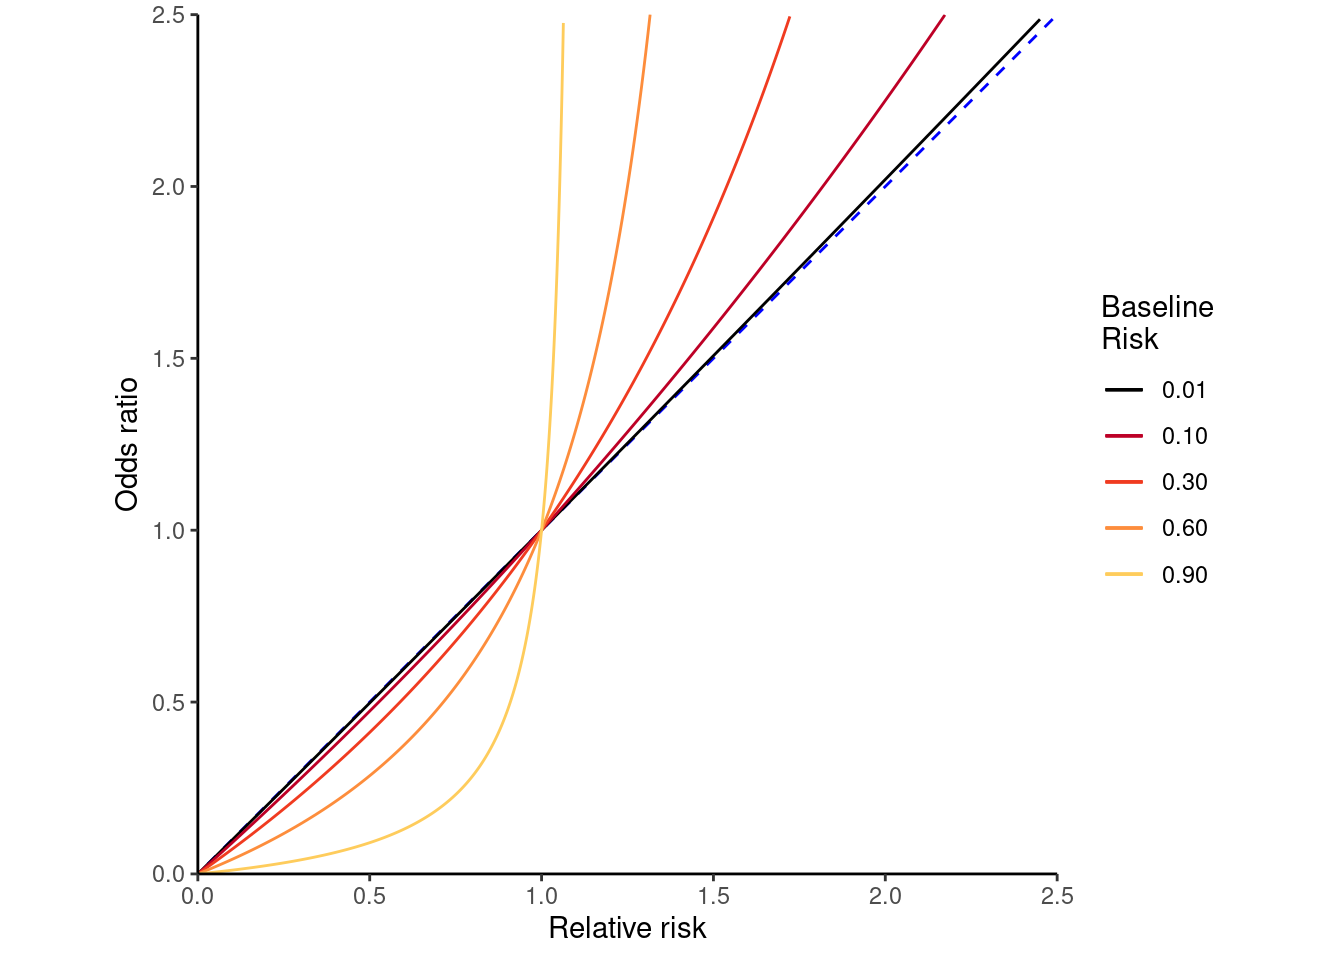
Logistic regression, a statistical model that computes odds ratios (OR) between groups, is often applied in cross-sectional studies to estimate relative risk (RR). However, ORs approximate RR only when the outcome is rare. If this is not the case, interpreting ORs as RRs will exaggerate risk estimates,21 as illustrated in Figure 3.4 (adapted from Wikipedia Commons).22
Figure 3.4: Relationship between odds ratio and relative risk depending on baseline risk
None of the outcomes in studies II & III were expected to be rare. Thus, logistic regression was unsuitable. Although log-binomial regression models are the most natural choice for computing relative risk in a mathematical sense, they are prone to convergence failure.23 Given the large number of outcomes and models that needed fitting, this presented a serious (although not insurmountable) inconvenience, and log-binomial regression was also discarded.
Robust Poisson regression (sometimes termed modified Poisson regression)24 presented an appealing alternative for modelling RR. A comprehensive description of the technique is beyond the scope of this dissertation, but a brief explanation is required, since ordinary Poisson regression is not the right tool for modelling binary outcomes as such data violate the assumptions behind the model.25 When applied to binomial data, the error for the estimated relative risk will be overestimated in an ordinary Poisson model. However, this problem can be addressed by using robust generalised estimating equations (so-called sandwich) variance estimates, which provide accurate standard errors in the presence of over-dispersion and excess zeros,26 such as in a binary distribution. Ultimately, this allows robust Poisson regression to estimate RR with valid confidence intervals in data with binary outcomes.27 It is worth noting that RR is merely a measure of relative probability, despite the semantics around risk implying that an adverse outcome is under study, which is not necessarily the case.
All regression models were modelled with native Danes as the reference group. To account for potential non-linearity, continuous variables were modelled as natural splines with knots placed at each quintile of the distribution in the respective study population. Supplementary analyses, where continuous variables were modelled as categorical variables (quintiles), were conducted for easier interpretation of these variables. In addition, the supplementary analyses included estimates of absolute risk differences corresponding to the above analyses. In these analyses, a generalised linear model using a Gaussian distribution and identity link with robust sandwich variance estimates was used to compute absolute risk difference with 95% confidence intervals.
In all three studies, the characteristics of study populations were presented. Continuous variables were presented with means and standard differences, and categorical variables were represented by absolute numbers and percentage proportions. In study I, the characteristics were tabulated according to self-reported, OSDC-classified and RSCD-classified diabetes type, whereas studies II and III tabulated the distribution of covariates and outcomes by origin group.
The following sections describe the statistical analyses of each study.
3.6.0.1 Study I
Validation analyses were performed separately for T1D and T2D, and each register-based diabetes classifier was validated against self-reported diabetes type. In the analyses of each diabetes type, diabetes type was modelled as a distinct binary variable; does the individual have this diabetes type or not (e.g. in the analyses of T1D, diabetes type was modelled as a binary variable of T1D vs. no T1D, the latter category including both T2D and non-diabetes cases).
Concordance tables and associated validation metrics were computed (with 95% confidence intervals) as defined in Table 3.2 and equations 3.1, 3.2, 3.3 and 3.4: sensitivity, specificity, positive predictive value (PPV) and negative predictive value (NPV). These validation analyses were bootstrapped in 1,000 random subsamples in order to assess robustness.
Table 3.2: Concordance table and validation metrics
Furthermore, analyses stratified by self-reported age at onset of diabetes (including all self-reported non-diabetes cases in both strata of age at onset) were performed to assess the influence of age at onset of diabetes on sensitivity and PPV.
3.6.0.2 Study II
Robust Poisson regression was used to compute RR and 95% confidence intervals in a series of cross-sectional analyses of T2D prevalence and eleven outcomes within T2D care.
In the analysis of T2D prevalence, RR of prevalent T2D was computed in a crude model and in two models with different levels of adjustment. This was done to explore the effects of clinical (model 1) and socioeconomic factors (model 2) on migrant risks. The first model adjusted for sex and age (model 1). The second model further adjusted for employment status, household income, duration of residence and region of residence (model 2). Additionally, age-specific T2D prevalence in each migrant group was modelled using a binomial model with log-link and restricted cubic splines as a function of age.
In the eleven analyses of T2D care, the RR of not receiving each type of guideline-level T2D care was computed in a crude model and in two adjusted models to visualise risk disparities in a clinical context separately from the fully adjusted model. The first model (model 1) adjusted for clinical risk factors in diabetes that may influence decision-making when planning diabetes care with the patient (sex, age, diabetes duration, prevalent macrovascular complications and DKD). The fully adjusted model (model 2) further adjusted for socioeconomic factors that may influence a patient’s health behaviour and healthcare service usage (employment status, household income, duration of residence and region of residence).
3.6.0.3 Study III
Similar to study II, robust Poisson regression was used to compute RR with 95% confidence intervals in three models for each outcome: an unadjusted model (crude), a model adjusted for clinical risk factors (model 1) and a model adjusted for clinical and socioeconomic factors (model 2). Compared to the models in study II, all adjusted models in study III contained adjustment for additional clinical risk factors (HbA1c level, LDL-C level and lipid-lowering drug usage), and the analyses of individual GLD type also included adjustment for the degree of combination therapy.
3.7 Ethics and approvals
In compliance with the General Data Protection Regulation, the handling of personal data in this PhD project was registered in the internal register of research projects (Danish: fortegnelsen) of Aarhus University, under file number 2016-051-000001, serial number 1339. Study II was approved by the Health In Central Denmark steering committee. The Health In Central Denmark research project is registered in the internal register of research projects (file number 1-16-02-165-20) in the Central Denmark Region.
Access to register data was provided and approved by the Danish Health Data Authority and Statistics Denmark. In Denmark, studies based entirely on survey and register data do not require further ethical approval.
World Health Organisation. International statistical classification of diseases and related health problems, 10th revision: Instruction manual, fifth edition [Internet]. {2016, last accessed 7 Feb 2023};Available from: https://icd.who.int/browse10/Content/statichtml/ICD10Volume2_en_2019.pdf
Wertheimer AI. The defined daily dose system (DDD) for drug utilization review. Hosp Pharm 1986;21(3):233–4, 239–41, 258.
9.
Bjerg L, Dalsgaard E-M, Norman K, Isaksen AA, Sandbæk A. Cohort profile: Health in central denmark (HICD) cohort - a register-based questionnaire survey on diabetes and related complications in the central denmark region. BMJ Open [Internet] 2022;12(7):e060410. Available from: http://bmjopen.bmj.com/content/12/7/e060410.abstract
10.
Christensen AI, Ekholm O, Glümer C, et al. The danish national health survey 2010. Study design and respondent characteristics. Scandinavian Journal of Public Health [Internet] 2012;40(4):391–7. Available from: https://doi.org/10.1177/1403494812451412
11.
DEFACTUM: Social & Health Services and Labour Market. DEFACTUM: Population Health Surveys [Internet]. {2022, last accessed 7 Feb 2023};Available from: https://www.defactum.net/research-areas/bif/
12.
RStudio Team. RStudio: Integrated development environment for r [Internet]. Boston, MA: RStudio, PBC; 2021. Available from: http://www.rstudio.com/
13.
R Core Team. R: A language and environment for statistical computing [Internet]. Vienna, Austria: R Foundation for Statistical Computing; 2020. Available from: https://www.R-project.org/
Carstensen B, Plummer M, Laara E, Hills M. Epi: A package for statistical analysis in epidemiology [Internet]. 2021. Available from: https://CRAN.R-project.org/package=Epi
16.
Harrison E, Drake T, Ots R. Finalfit: Quickly create elegant regression results tables and plots when modelling [Internet]. 2021. Available from: https://CRAN.R-project.org/package=finalfit
17.
Wickham H, Averick M, Bryan J, et al. Welcome to the tidyverse. Journal of Open Source Software 2019;4(43):1686.
18.
Halekoh U, Højsgaard S, Yan J. The r package geepack for generalized estimating equations. Journal of Statistical Software 2006;15/2:1–11.
Frerebeau N. Khroma: Colour schemes for scientific data visualization [Internet]. Pessac, France: Université Bordeaux Montaigne; 2021. Available from: https://doi.org/10.5281/zenodo.1472077
Williamson T, Eliasziw M, Fick GH. Log-binomial models: Exploring failed convergence. Emerging Themes in Epidemiology [Internet] 2013;10(1):14. Available from: https://doi.org/10.1186/1742-7622-10-14
Chen W, Qian L, Shi J, Franklin M. Comparing performance between log-binomial and robust poisson regression models for estimating risk ratios under model misspecification. BMC Medical Research Methodology [Internet] 2018;18(1):63. Available from: https://doi.org/10.1186/s12874-018-0519-5